
Your Search Console sent a “Core Web Vitals: poor URLs detected” email, or you ran a page through PageSpeed Insights and got a red Failed badge. Now you’re staring at a score and wondering how much traffic it’s quietly costing you.
We get this question most weeks, usually from owners who just watched a competitor climb past them and assumed the speed report was the reason. Sometimes it’s part of the story. Often it isn’t. This page explains what a failing score actually means for rankings in 2026, which 2026 changes are real and which are hype, and the one place to start that won’t waste a week of developer time.
What a failing Core Web Vitals score usually means
First, the reassuring part. A poor rating on its own rarely tanks a healthy site overnight. Core Web Vitals are a confirmed Google ranking factor, but a modest one. Google has been consistent here: page experience helps decide between pages of similar quality, and it will not lift weak content over strong content.
So when a site drops and the owner blames speed, the cause is usually somewhere else. In most cases we audit, the real driver turns out to be crawling, indexing, or thin pages competing with stronger ones, not a tenth of a second on Largest Contentful Paint. Speed gets the blame because it arrives with a red badge and an email. The actual ranking problem is often quieter and harder to see.
That doesn’t mean ignore it. A genuinely slow site loses conversions and gives Google a reason to prefer a faster competitor when everything else is close. It means treat the score as one input, not a verdict.
Which 2026 changes are real, and which are hype
There’s a lot of noise this year. You’ve probably read that Google dropped the “good” LCP threshold to 2.0 seconds in a March 2026 update, or that a new Visual Stability Index is now a ranking factor. We checked Google’s own documentation before repeating any of it.
The published thresholds have not moved. Google’s Search Central docs, last updated in December 2025, still list the same targets: LCP under 2.5 seconds, INP under 200 milliseconds, CLS under 0.1. Google has also said its stable metrics won’t change more than once a year. The “2.0 second” and “Core Web Vitals 2.0” claims trace back to SEO blogs citing each other, not to Google.
What did change is smaller and worth knowing. The measurement of INP got tighter, single-page-app tracking expanded in Google’s real-user dataset, and Time to First Byte became a more prominent diagnostic inside PageSpeed Insights without becoming a ranking signal itself. If you were borderline on INP, you might now be failing on the very same code. Nothing else about the rules of the game shifted.
The three metrics that actually move your score
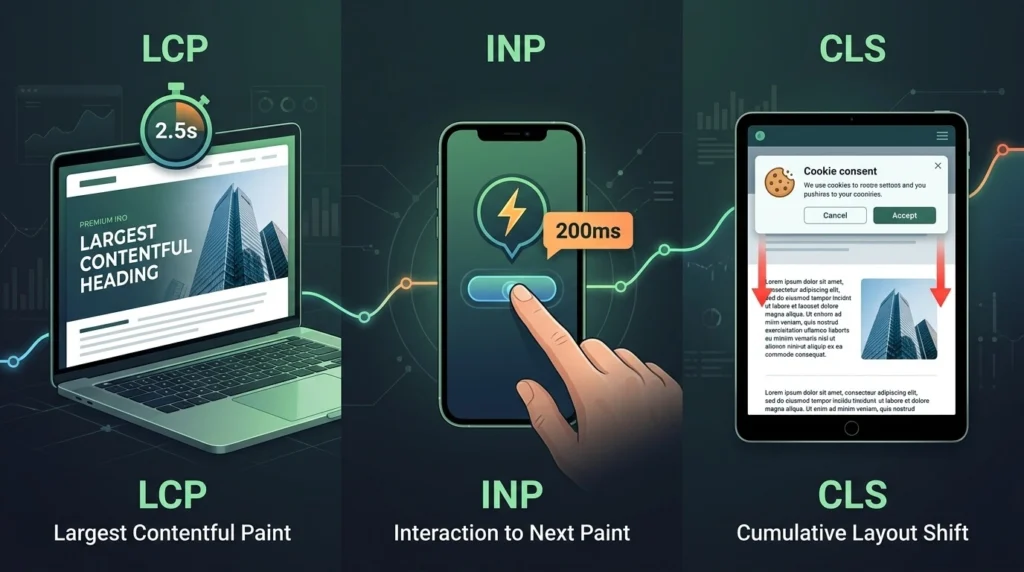
Three numbers make up the assessment, and each fails for different reasons.
- Largest Contentful Paint (LCP) measures how long until the biggest thing above the fold appears, usually a hero image, a heading block, or a featured image. Target: under 2.5 seconds. It fails most often on blog posts and homepages, and the cause is almost always an oversized image or a slow server response, not some exotic setting.
- Interaction to Next Paint (INP) measures how quickly the page reacts when someone clicks, taps, or types. Target: under 200 milliseconds. INP replaced First Input Delay back in March 2024, and by 2026 it’s the metric most sites still fail. The culprit is nearly always JavaScript: chat widgets, analytics, ad scripts, or a heavy page builder doing too much work on the main thread.
- Cumulative Layout Shift (CLS) measures how much the page jumps around while loading. Target: under 0.1. It fails when images and ad slots have no reserved dimensions, or when a cookie banner shoves content down just as someone is about to tap.
All three are scored at the 75th percentile of real visitors. In plain terms, 75 out of every 100 visits need a good experience for the page to pass.
“Muhammad is an excellent SEO Expert. He totally understands SEO inside out and delivers results that actually make a difference. Crazy how optimizing our website and content started bringing us true, qualified leads right to our doorstep relatively quickly. Communication was easy, and he always kept me updated on progress. Very professional, knowledgeable, and reliable. I’d absolutely work with him again.” – Melissa Gerhold
Why your PageSpeed Insights or GTmetrix score doesn’t match Search Console
This one confuses almost everyone. You run a page through GTmetrix, see a different number than PageSpeed Insights, and neither matches Google Search Console. Nothing is broken.
The split comes down to lab data versus field data. GTmetrix and the top section of a PageSpeed Insights report run a lab test: one simulated load, from one location, on one connection. That’s handy for debugging because it’s repeatable. But Google does not rank on lab data. It ranks on field data, the real-user measurements collected in the Chrome User Experience Report and shown in Search Console and the field section of PageSpeed Insights.
That gap explains a lot of wasted effort. A page can score 95 in a lab test and still fail in the field, because real visitors are on mid-range Android phones over patchy mobile connections, not the data-center link running the lab test. Mobile field data is what counts, even for desktop rankings.
The working rule we give clients: use GTmetrix and Lighthouse to find and fix causes, then confirm the win in field data over the following weeks. Never declare victory off a lab score alone.
Where to actually start with Core Web Vitals optimization
The mistake we see most is fixing page by page. Someone optimizes one slow URL, watches it go green, then realizes a thousand other pages built on the same template still fail. Fix the template and you fix every page on it, including the ones you haven’t published yet.
Here’s the order that wastes the least time:
- Open the Core Web Vitals report in Google Search Console and find which page groups fail, and on which metric. Begin with the template behind the most URLs.
- Run two or three representative pages through PageSpeed Insights. Read the field data first, the lab data second.
- Match each failure to its usual cause: LCP to images and server response, INP to JavaScript, CLS to missing dimensions.
- Fix the cause at the template level, then wait for the 28-day field-data window to refresh before judging the result.
If you want a structured way to check the wider picture around a slow score, our Technical SEO Audit Checklist covers the crawl, indexing, and structural issues that often sit underneath it. For the official numbers, Google’s own page on Core Web Vitals and Search is the source worth trusting over secondhand blog claims.
“Muhammad was fantastic to work with! He quickly identified and resolved several technical SEO issues on our SaaS site, improving performance. I’d definitely love to work with him again on future projects!” – “ Brandon Parham“
Frequently asked questions
Q.1 : Are Google Core Web Vitals really a ranking factor?
Yes, but a modest one. Google confirmed Core Web Vitals as part of its page experience signals, and they act as a tiebreaker between pages of similar quality. They will not push thin content above strong content. Treat a good score as a competitive edge in close races, not as a shortcut to the top.
Q.2 :What is a good Core Web Vitals score in 2026?
A page passes when all three metrics reach “good” at the 75th percentile of real users: LCP under 2.5 seconds, INP under 200 milliseconds, and CLS under 0.1. Despite claims of tighter 2026 thresholds, Google’s documentation still lists these same numbers. One metric in the poor range fails the whole assessment.
Q.3 :Why does GTmetrix show a different score than Google Search Console?
Because they measure different things. GTmetrix runs a lab test from one machine on one connection, while Search Console reports field data from real Chrome users. Google ranks on the field data, not the lab score. Use GTmetrix to diagnose a problem, then confirm the fix in Search Console once enough real-user data has built up.
Q.4 :How long before Core Web Vitals fixes show up?
Field data runs on a rolling 28-day window, so a real fix usually takes four to six weeks to fully reflect in Google Search Console. If the numbers don’t move after a deploy, check that the change actually reached the live template, and that real visitors, not just your lab test, are getting the faster experience.
Q.5:My LCP passes but INP is failing. What do I do?
INP almost always traces back to JavaScript. Start with third-party scripts: chat widgets, analytics, and ad tags that block the main thread. Defer or remove what you can. If a heavy page builder is generating most of the script, there’s a ceiling on how far you can push INP without addressing the underlying build.
Get a clear answer on what’s actually holding your rankings back
If your rankings slipped and you’re not sure whether speed is the cause or just the symptom, that’s the exact question a proper diagnosis answers. Our technical SEO service starts with a forensic audit that separates Core Web Vitals from the crawl, indexing, and structural issues that more often drive a drop. You’ll walk away with a prioritized list of what to fix, in what order, and what to leave alone. Most audits take a few days to turn around.